

Agustin G. answered • 03/22/24
Tutor
5
(2)
Effective English Tutor Specializing in Reading and Test Prep Skills
"""
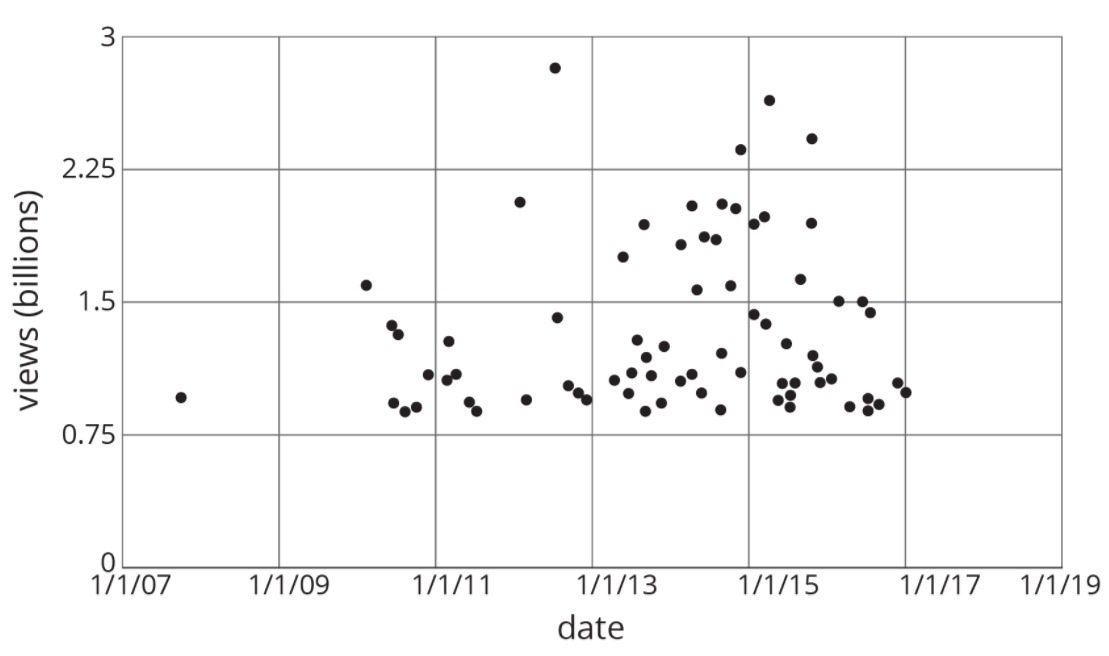
The scatter plot you've provided shows data points
that represent the number of views of the most
popular videos over a span of ten years. To estimate
the number of views for the most popular video, we
look for the highest data point on the vertical axis
labeled "views (billions)."
Since this is an estimation based on visual inspection,
the most popular video appears to be just below the 3
billion views mark. It's hard to be precise without the
exact values, but it seems safe to say that the most
popular video had around 2.9 billion views or possibly a
bit less. This video occurred between 1/1/11 and 1/1/13,
but closer to 1/1/13.
"""


