Taylor H. answered • 06/13/21
College Student Specializing in Mathematics and Spanish
Part a
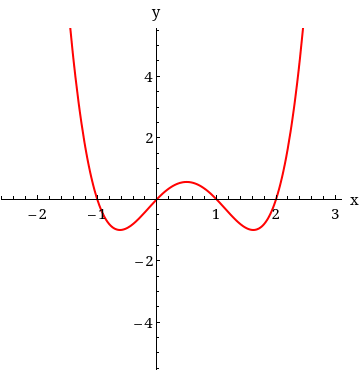
With a graph, we can find all of the solutions to the equation by looking for all of the x-intercepts. On this graph, the line of our equation crosses the x-axis at -1, again at 0,1, and 2. All of these points are our solutions.
x = -1, 0, 1, 2
Part b
When an inequality is added to the equation, we are not looking for a single value as the answer. The solution will be a range of values, not a single value. Since our equation is ≤ , we need the sections where the equation is below the x-axis. On the graph, the line drops below the x-axis at -1 and crosses into the top quadrants at 0. So, [-1,0] is our first range. We do not want to include any sections above the x-axis, which is why we stop the interval at 0. However, our line crosses the x-axis again. The line crosses the x-axis into the bottom quadrants at 1 and crosses into the top quadrants at 2. This is our second range. We write this solution as [-1, 0]U[1,2].
x = [-1, 0]U[1,2]


