


Karina F. answered • 11/05/20
Engineer & Mom who loves to teach!
What a great problem!
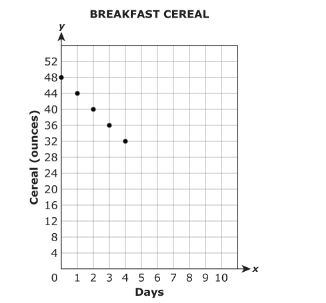
To get your DOMAIN and RANGE, you need to have ALL your ordered pairs (x, y) from the graph. From what is shown the ordered pairs are (0, 48), (1, 44), (2, 40), (3, 36) and (4, 32.) You can obtain the rest by connecting all the plots on the graph creating a straight line until it crosses the x-axis.
The DOMAIN of a function are the 1st coordinates of all ordered pairs...here it start with (0, 1, 2, 3 4)
The RANGE of a function are the 2nd coordinates of all ordered pairs...here it would be (48, 44, 40, 36, 32)
The RATE OF CHANGE is basically the slope of the line (from connecting the points shown.) In this example the slope represents the rate at which the cereal is being consumed (delta y) with each passing day (delta x.)
The X-INTERCEPT is the point at which the line (from connecting the points shown) CROSSES the x-axis. This is the DAY that there is NO more cereal or y = 0.
The Y-INTERCEPT is the point at which the line (from connection the points shown) CROSSES the y-axis & x = 0. Clearly the Y-INTERCEPT is 48. This is basically the day the cereal box is new or is at the fullest.
The function is positive until the cereal runs out. If you connect the points, it looks like the line would cross the x-axis at day 12 and that's when y =0 (no more cereal.) So the interval is from Day 0 to Day 12.
The function is negative affect Day 12 (see above)...past Day 12 there is no cereal until infinity so an interval is not applicable or from Day 12 to infinity.
Hope that helps...


