
Christopher J. answered • 11/02/20
Tutor
New to Wyzant
Enthusiastic Tutor Experienced in Physics and Math
Short answer: 2) It is decreasing in the time interval 0 < x < 2 hours.
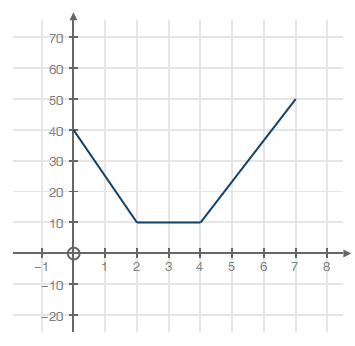
More complete answer: From the available options, we have 2 intervals to look at, either 10 to 50 hours or 0 to 2 hours. Seeing our graph, we don't even hit 8 hours (we have no data past 7), so it could not be the 10 to 50 hour interval, ruling out 1) and 3).
We can see 0 to 2 hours, meaning it could be 2) or 4). At time 0 our temp is 40C, while at time 2 our temp is 10C. We dropped from 40 to 10 Celsius, or in other it is decreasing, meaning answer 2)!