David B. answered • 02/18/21
Math and Statistics need not be scary
This worked for me, you might have to tweek the boxplot function if it causes error on call from inside the function.
#enter dataset
DLenrol<- data.frame(enrollement =c(2,1,0,4,10,3,9,8,
+ 0,9,10,6,20,23,8,23,34,6,45,52))
DLenrol$term <- c(1:20)
attach(DLenrol) # make it easier to address vectors
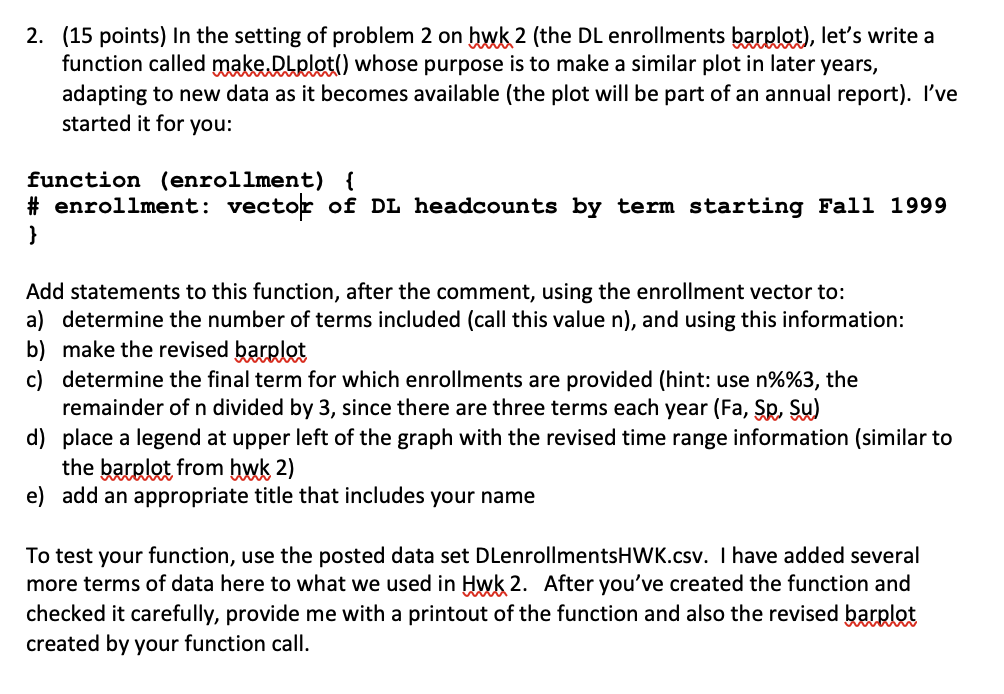
make.DLplot <- function(enrollment) {
# enrollment: vector of DL headcounts by term starting Fall 1999
Term<-c("Fall","Spring","Summer")
n<- length(enrollment)
Finter<-Term[n%%3]
finyr<-(n+1)%/%3+1999
b.plot<-barplot(enrollement ~ term, main = "My bar chart, your name"
, legend("topleft", paste("Enrolments from Fall 1999 to "
, Finter ,finyr, sep = " ")))
return(b.plot)
}
output <-make.DLplot(DLenrol$enrollement)


