


Patrick B. answered • 01/19/21
Math and computer tutor/teacher
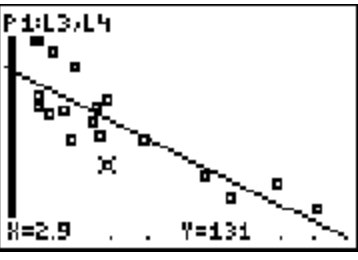
X is the wine consumption
Y is the death rate
Wish to show that Y decreases as X increases
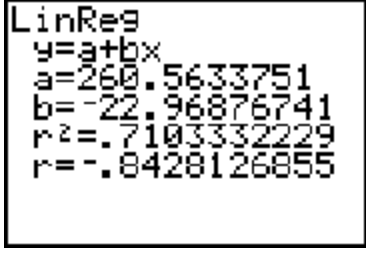
Per the results of the linear regression done
via the calculator:
y = -22.96876741 X + 260.5633751
So for every liter the wine consumption increases,
the death rate drops by 22968
The death rate begins at 260,563 if no one drinks wine
for x = 8, the death rate is -22.96876741 *8 + 260.5633751 = 76.81323582k
= 76813
The closer the R-coefficient is to 1 or 0, the better...
0.71 is fairly strong linear model
Though not asked, by it was so tempting I could not resist...
ACCORDING to the model, at this rate, if everybody drink 11.344247187881641751537071270295
liters, the death rate will be ZER0
That's about 2 gallons and 3 quarts of wine in one year...
SALUTI !!!


Alex S.
Thank you my friend!01/20/21