


Kc is the equilibrium constant, which can be used to signify the extent of the reaction. In equilibrium reactions, the reaction occurs in both the forward and reverse directions. So this constant tells you how much the forward reaction is favored over the reverse. The higher the equilibrium constant, the more the forward reaction is favored. This means the equilibrium concentration (where the mixture stays even though both forward and reverse reactions are still occurring) will have more product in it than one would with a lower equilibrium constant.
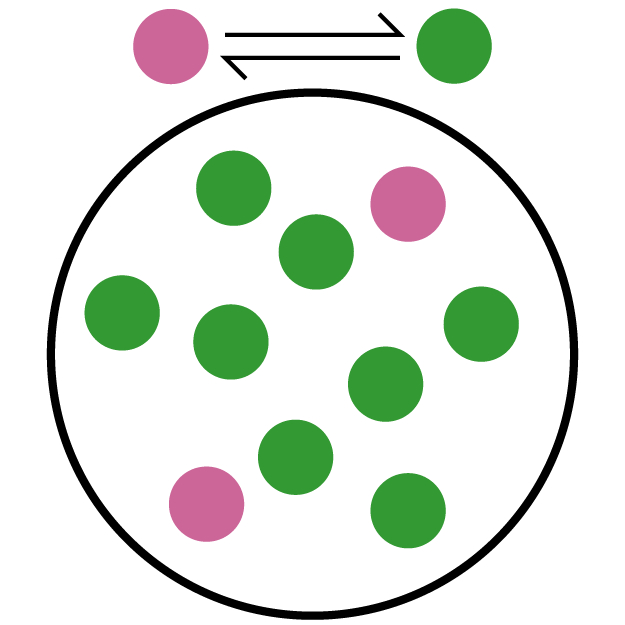
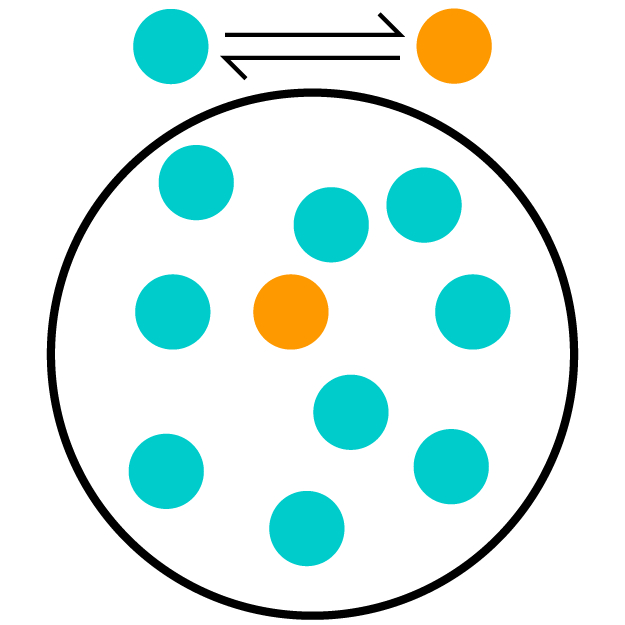
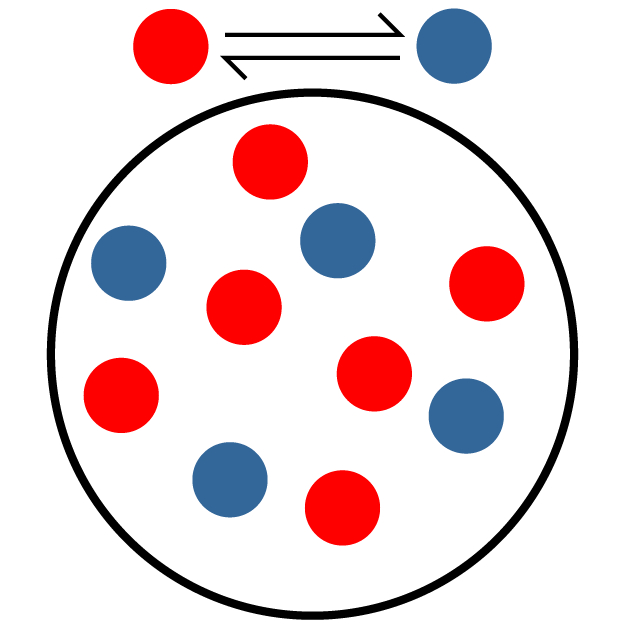
The second (teal and orange) picture has mostly reactant (teal) molecules. Only one of the 10 molecules is a product, so this has the lowest Kc. The third (red and blue) picture has 4 product (blue) molecules out of 10, which means it has the middle Kc. The first (pink and green) picture has mostly product (green) molecules. With 8 out of 10 molecules as products, this has the highest Kc.


