


Francesca D. answered • 11/12/20
Tutor
5.0
(185)
Organic Chem Teacher with >5yrs of Individual Tutoring Experience
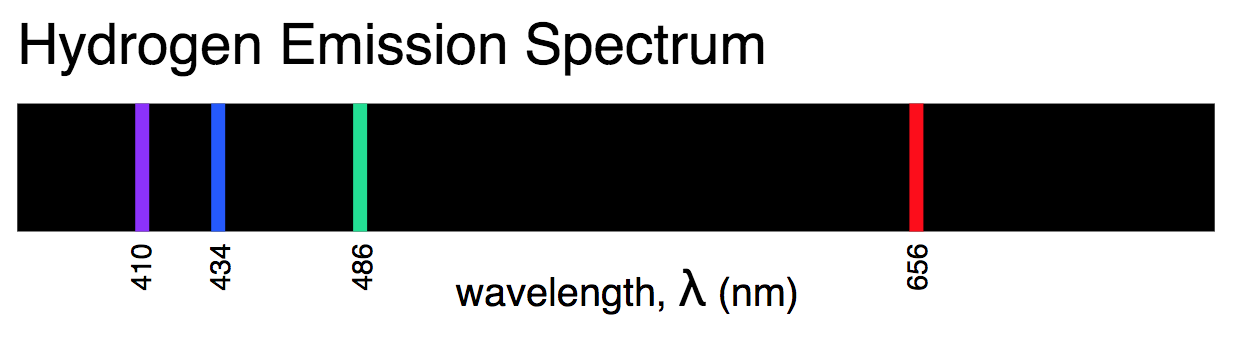
Each of these bands falls to the same energy level, n = 2, so we know that each falls within the Balmer series, which ejects photons with wavelengths in the visible spectrum.
To evaluate which photon will relate to each color:
- First, we know that Energy & Wavelength are inversely related: E = hf / λ
- Second, given that all electrons in Fig. A–D are falling to the same energy level (n = 2), falling from higher energy levels (ex. n= 6 ––> n = 2) relates to releasing greater energy.
- Third, each diagram describes the energy levels fallen and the frequency of each ejected photon:
- Fig. A – n = 6 ––> n = 2, highest Energy, shortest λ (PURPLE)
- Fig. B – n = 5 ––> n = 2, 2nd highest Energy, 2nd shortest λ (BLUE)
- Fig. C – n = 4 ––> n = 2, 2nd lowest Energy, 2nd longest λ (GREEN)
- Fig. D – n = 3 ––> n = 2, lowest Energy, longest λ (RED)
Hope this provides some clarity of the relationship between the Bohr model, photon energy, and wavelength!


