

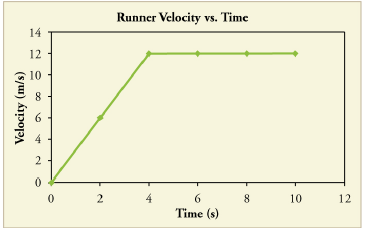

a) You can read it off the graph or use vavg = (v2+v1)/2 for the interval t= 0 to 4 and const a (linear)
b) Instantaneous velocity is read off of the graph at t = 6.
c) avg a = (v2-v1)/(t2-t1) for t = 0 to 4 (avg a is the total velocity change divided by total time interval)
d) This is a little deceptive as the d under the curve is 1/2(12 m/s)(4s) + 12m/s(10s - 4 s) = 96 meters, which is not the length of the race. I think this is probably a mistake and the answer they are looking for is 10 seconds. If not you need to add 4 meters/12 m/s to the 10 seconds.
Please consider a tutor.


