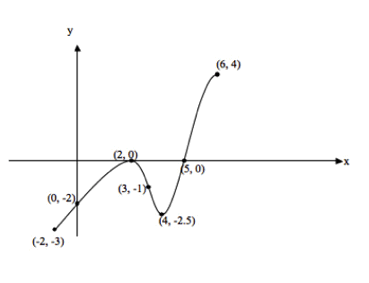
If we want to analyze f(x) from this graph of f’(x), we need to look at the integral of f’(x). Graphically, this will translate to the “area under the curve,” i.e., the area of the region bound by the graph and the x-axis. Since we want f(x) to be at its absolute minimum (or at its most negative), we want to find the point where the total area beneath the x-axis is at its greatest. This occurs at x = 5.
To put it another way, keep in mind that f’(x) is a function of the slope of the tangent line to f(x) at each individual point; whenever f’(x) < 0, f(x) must be sloping downward. Since we want the absolute minimum of f(x) on this interval, we are looking for the point at which f(x) stops sloping downward and starts sloping upward, i.e., where f’(x) switches from negative to positive. This occurs at x = 5.


