

Raymond B. answered • 01/21/26
Tutor
5
(2)
Math, microeconomics or criminal justice
h=-3sqr2 +18 is
equation of the line
last option 18 cm is previous night
Hayden M.
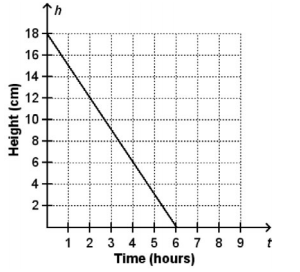
asked • 11/04/20The state of Montana is experiencing a warm day after a heavy snowfall. The graph shows the height of snow, h, in centimeters after t hours.
What linear function does the graph represent.
h= 3t+6
h= 3t +18
h=-3t+18
h=-3t+6
The initial value represents which of the following?
The amount of snow melting each hour.
The amount of snow remaining after four hours.
The amount of snow that accumulated the previous night.
Raymond B. answered • 01/21/26
Math, microeconomics or criminal justice
h=-3sqr2 +18 is
equation of the line
last option 18 cm is previous night
Get a free answer to a quick problem.
Most questions answered within 4 hours.
Choose an expert and meet online. No packages or subscriptions, pay only for the time you need.
Answers · 3
Answers · 4
Answers · 1
Answers · 2
Answers · 4

Priti S.
5.0 (806)
Cindy M.
5.0 (1,338)
Beth E.
4.9 (1,293)