


Brad M. answered • 03/02/24
Tutor
4.9
(907)
Calculus for AP, Engineering, and Business VT MATH 1225-6, 1524-6
Graphically, we're cooling about 50F per hr, or 0.8F per min :)
All G.
asked • 02/27/24A roast turkey is taken from an oven when its temperature has reached 185°F and is placed on a table in a room where the temperature is 75°F. The graph shows how the temperature of the turkey decreases and gradually approaches room temperature.
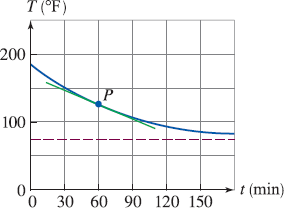 There are multiple items on a coordinate plot where the horizontal axis is t in minutes and the vertical axis is T in degree F. The first item is a curve that starts at (0, 185), passes down and to the right through point (60, 132) labeled P, and flattens out to slightly more than 75 as the time increases. There is a horizontal line at T = 75. The point P has a tangent line passing through it. The tangent line passes through the approximate points (30, 147) and (90, 105).
By measuring the slope of the tangent, estimate the rate of change of the temperature after an hour (in °F/min). (Round your answer to one decimal place.)
Brad M. answered • 03/02/24
Calculus for AP, Engineering, and Business VT MATH 1225-6, 1524-6
Graphically, we're cooling about 50F per hr, or 0.8F per min :)

Denise G. answered • 02/27/24
Algebra, College Algebra, Prealgebra, Precalculus, GED, ASVAB Tutor
The rate of change at that point will be the slope of that tangent line. It tells us the tangent line goes through (30,147) and (90,105) So we would use these point for the slope equation.
m = (y2-y1)/(x2-x1) = (147-105)/(30-90) = 42/-60 = -0.7
Get a free answer to a quick problem.
Most questions answered within 4 hours.
Choose an expert and meet online. No packages or subscriptions, pay only for the time you need.
Answers · 3
Answers · 7
Answers · 3
Answers · 8
Answers · 4

Whitney T.
5 (483)
Torin C.
5 (201)
Nicholas P.
5 (321)