


Mark M. answered • 09/17/23
Tutor
5.0
(278)
Mathematics Teacher - NCLB Highly Qualified
I would go with b.
Do you know why?
Pauline Y.
asked • 09/17/23Identify the graph with the following properties.
lim𝑥→1+𝑓(𝑥)=∞, lim𝑥→1−𝑓(𝑥)=3, lim𝑥→4𝑓(𝑥)=−∞
Choose the corresponding graph.
a. 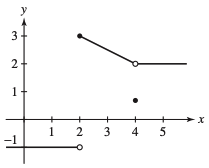
b.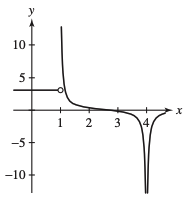
c.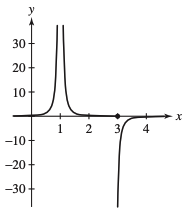
d.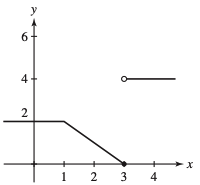
Mark M. answered • 09/17/23
Mathematics Teacher - NCLB Highly Qualified
I would go with b.
Do you know why?
Get a free answer to a quick problem.
Most questions answered within 4 hours.
Choose an expert and meet online. No packages or subscriptions, pay only for the time you need.
Answers · 3
Answers · 7
Answers · 3
Answers · 8
Answers · 4

Whitney T.
5 (485)
Torin C.
5 (201)
Nicholas P.
5 (321)