Archie M. answered • 04/08/22
PhD Math Specialist: SAT/GRE Strategy & Advanced University Logic
(a)
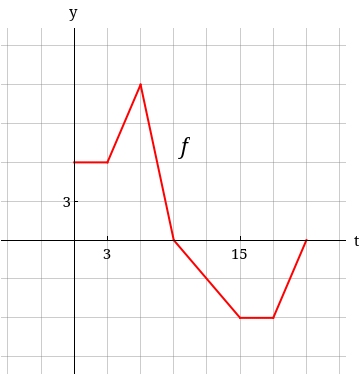
- g(0) is the integral from 0 to 0 of f(t) with respect to t, so g(0) = 0.
- g(3) is the integral from 0 to 3 of f(t) with respect to t, so this is the area between the graph of f(t) and the t-axis on the t-interval (0, 3), which is the area of a rectangle with height 6 and width 3, so g(3) = 18.
- g(6) is the integral from 0 to 6 of f(t) with respect to t, so this is the area between the graph of f(t) and the t-axis on the t-interval (0, 6), which is the the previous area plus the area of a copy of that rectangle and half of that rectangle, so g(6) = 18 + 18 + 9 = 45.
- g(9) is the integral from 0 to 9 of f(t) with respect to t, so this is the area between the graph of f(t) and the t-axis on the t-interval (0, 9), which is the the previous area plus the area of half of a 12x3 rectangle, so g(6) = 45 + 18 = 63.
- g(18) is the integral from 0 to 18 of f(t) with respect to t, so this is the area between the graph of f(t) and the t-axis on the t-interval (0, 18), which is the the previous area MINUS the area of the polygon under the t-axis on the t-interval (9, 18), which consists of half of a 6x6 rectangle and a 6x3 rectangle, so g(18) = 63 - (18 + 18) = 27.
(b) g is increasing from x=0 to x=9 since g increases from g(0)=0 to g(9)=63, so g is increasing on the interval (0, 9).
(c) g has a maximum value at x=9 because g increases from 0 to 63 (see part b) but then decreases from there since we subtract the area under the t-axis.
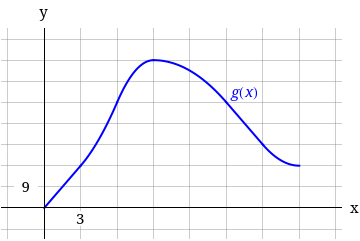
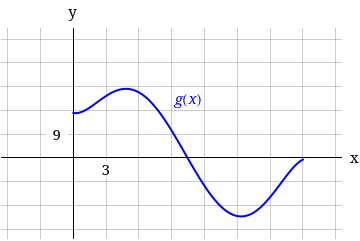
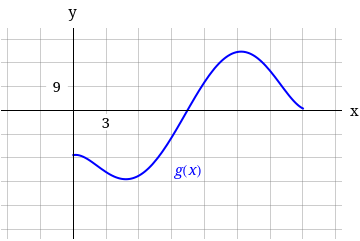
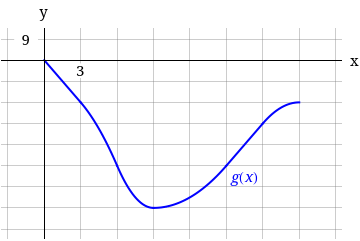
(d) Based on the answers in parts a-c, the graph of g is the top-left graph.


