Mark M. answered • 12/17/20
Mathematics Teacher - NCLB Highly Qualified
(1)(2) + (0.5)(1)(2) + (2)(1) + (0.5)(2)(1) +(1)(5) = ?
Cao N.
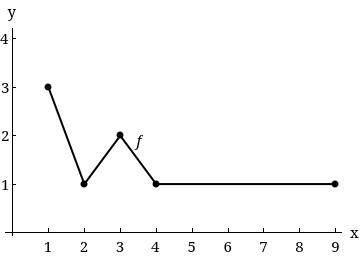
asked • 12/17/20The graph of f is shown in the figure.

(a) Evaluate ∫19 f(x) dx
(b) Determine the average value of f on the interval [1, 9].
(c) Determine the answer to part (a) when the graph is translated three units upward.
Determine the answer to part (b) when the graph is translated three units upward.

Mark M. answered • 12/17/20
Mathematics Teacher - NCLB Highly Qualified
(1)(2) + (0.5)(1)(2) + (2)(1) + (0.5)(2)(1) +(1)(5) = ?
Get a free answer to a quick problem.
Most questions answered within 4 hours.
Choose an expert and meet online. No packages or subscriptions, pay only for the time you need.