


Jackson B. answered • 07/07/20
Calculus Tutor (5 on AP Calc BC Test)
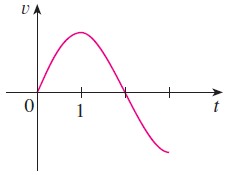
To clarify (or just re-phrase), speeding up is another way to say that the particle has positive acceleration. Slowing down says that the particle has negative acceleration. As we are able to see the velocity graph (which appears to be some sort of a sinusoid), taking the derivative of the velocity function will give us the acceleration function.
In other words, if a point on the graph has a positive instantaneous slope, this means that the acceleration is positive. Similarly, if a point on the graph has a negative instantaneous slope, the acceleration is negative.
The graph appears to go from x = 0 to x = 3, or the interval [0,3]. As the function is continuous, the graph will only change from positive to negative or vice versa when there is a critical point. There appears to be two critical points at x = 1 and x = 3. The best way to finish the problem is with a table.
x | 0 | 1 | 2 | 3 |
-------|---------|----------|----------|----------|
a(x) | | | | |
As the critical points are x = 1 and x = 3 for the velocity graph, we need a point to test before and after each critical point (x = 0 and x = 2). However, we do not need a point to test after x = 3 because the graph does not continue past x = 3. On the acceleration row, + will signify a positive acceleration, - will signify a negative acceleration, and 0 will represent when the acceleration equals zero.
x | 0 | 1 | 2 | 3 |
-------|---------|----------|----------|----------|
a(x) | + | 0 | - | 0 |
From this chart, we can see that the particle in figure (a) is speeding up on [0, 1) and the particle is slowing down on (1, 3). We use parentheses near 1 and 3 to show that these points are not included in the interval. At these points, the particle is neither accelerating nor decelerating, so they cannot be included in speeding up or slowing down.


