Simon G.
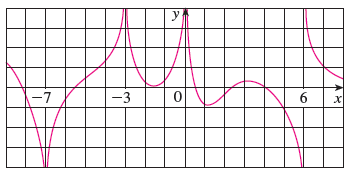
asked • 06/17/20For the function f whose graph is shown, state the following. (If an answer does not exist, enter DNE.)

(a) lim x → −7 f(x)
(b) lim x → −3 f(x)
(c) lim x → 0 f(x)
(d) lim x → 6− f(x)
1 Expert Answer

Nitin P. answered • 06/17/20
Machine Learning Engineer - UC Berkeley CS+Math Grad
a) Yes, both sides converge to the vertical asymptote, so the limit is -∞.
b) Yes, same reason as above, the limit is ∞.
c) Yes, same as above, limit ∞.
d) Yes, we only care about the left side, which converges to -∞.
Simon G.
I forgot to add this part in the question. Could you please explain the steps? (e) The equations of the vertical asymptotes.06/17/20

Nitin P.
The only step here is inspection. We look at the specified values that x approaches, and see what the function value approaches. The vertical asymptotes are the vertical lines where the function approaches positive or negative infinity, which in this case are x = -7, x = -3, x = 0, and x = 6.06/17/20
Maulida A.
How about, if this question like this lim x → 6+ f(x)10/27/20
Still looking for help? Get the right answer, fast.
Get a free answer to a quick problem.
Most questions answered within 4 hours.
OR
Choose an expert and meet online. No packages or subscriptions, pay only for the time you need.


Simon G.
(e) The equations of the vertical asymptotes.06/17/20