Lenny D. answered • 01/16/20
Former Tufts Economics Professor and Wall Street Economist
We have MP Rising, Peaking and Then Falling. At its Peak AP=MP.
AVC= W/AP Why? Explain. If I hire 10 worker and get 100 units of output I am getting (on Average) 10q per worker. If I have to pay each worker 10 dollars, My total labor or variable cost is $100 or $1 per Unit
MC=W/MP Why? Explain If I hire one more worker and he produces an ADDITIONAL 10 units (MP=10) and he cost me $10 to hire it costs me (incrementally) $1 to expand. IF MP is initially rising then falling then w/MP is doing just the opposite. Convince yourself of this.
AFC = rK/Q Which is always Falling Why? Explain If it Costs $100 to rent a Machine and I hire no worker, I produce nothing. The more worker I here, the more I produce. If I hire 10 workers and get a total of 100 units of output. My fixed cost is still $100 but it is $1 per Unit of output
Consider this table
| Labor | MP | TP | AP |
| 0 | 0 | ||
| 1 | 5 | 5 | |
| 2 | 10 | 15 | 7.5 |
| 3 | 15 | 30 | 10 |
| 4 | 10 | 40 | 10 |
| 5 | 5 | 45 | 9 |
| 6 | 2 | 47 | 47/6 |
| 7 | 0 | 47 | 47/7 |
Let K= 1 machine which costs $100 to Rent. Let w=10.
You should be able to create this table
| Q | Fixed Cost | Variable (labor) Cost | Total cost |
| 5 | 100 | 10 | 110 |
| 15 | 100 | 20 | 120 |
| 30 | 100 | 30 | 130 |
| 40 | 100 | 40 | 140 |
| 45 | 100 | 50 | 150 |
| 47 | 100 | 60 | 160 |
| 47 | 100 | 70 | 170 |
You should then be able to create this table
| Q | AFC | Average Variable (labor) Cost | ATC | |
| 5 | 100/5 | 10/5 | 110/5 | |
| 15 | 100/15 | 20/15 | 120/15 | |
| 30 | 100/30 | 30/30 | 130/30 | |
| 40 | 100/40 | 40/40 | 140/40 | |
| 45 | 100/45 | 50/45 | 150/45 | |
| 47 | 100/47 | 60/47 | 160/47 | |
| 47 | 100/47 | 70/47 | 170/47 |
If You Sketch out these Tables You can also sketch in MC and show that is Intersect AVC and ATC at there minimums.
Economies of Scale exist when changing all factors by the same factor of proportion increases output by a greater factor of proportion. For example, Doubling all inputs triples all outputs. If we double all inputs. TC will double but output more than doubles so Cost per unit declines
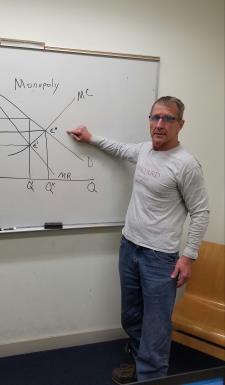
A Long Run average cost Curve (all inputs expanding optimally) will be decreasing with economies of scale, Flat with Constant returns to scale and increasing with diseconomies of scale. I have been trying to do a video answer for you here But I can’t get the whiteboards Up.
If you need help, reach out and we cam book something where I can show you exactly how to do the graphs and Why they make sense.
Best, Lenny


